In the fall of 2018, Colorado voters decided whether new or modified oil and gas wells should be set back 2,500 feet from homes, schools, streams, and other human developments or environmental features. The measure, known as Proposition 112 (Prop112), would have dealt a substantial blow to the oil and gas industry in Colorado. According to the Colorado Oil and Gas Conservation Commission, the state regulator, passage of Prop112 would have made about 80 percent of Colorado’s surface area off limits for drillers. (This arrangement excludes federal lands and does not account for the ability of operators to drill horizontally underground.) The oil and gas industry spent heavily on a marketing campaign to sway voters, focusing on the economic consequences of such restrictions. In the end, Coloradans rejected Prop112 with a 56 percent majority.
As researchers who have worked extensively on the socioeconomic effects of oil and gas development (with one of us—Morgan—based in Colorado), we eagerly awaited the results of the election. Once it was over, we wanted to know about the factors that swayed the vote. In a new paper published this week in the journal Energy Research & Social Science, we found some answers.
The Great Divide
A historic surge in US natural gas and oil production has taken place in a mix of locations over roughly the last 10 years. Some states, such as Texas, Oklahoma, and North Dakota, have unambiguously welcomed the growth in production. Others, such as New York, have preemptively banned fracking in an effort to prevent the practice from taking root. Somewhere in the middle, we find Colorado, where drilling has moved forward briskly, but with substantial efforts to restrict the industry. A few cities and counties along the state’s Front Range have attempted to ban fracking (and lost in court), while the state government over the last 10 years has often led the nation by adopting new regulations on fracking fluid disclosure, methane emissions, public health monitoring, gas gathering lines, and more.
Colorado’s diversity of opinions, economic and energy development, and geography offer a rich environment for researchers like us. Oil and gas development occurs in parts of the state that are both rural and urban, liberal and conservative, mountainous and flat. Drilling rigs and pump jacks are old hat in some regions, while the industry is relatively new in others. At the same time, the state’s Front Range—stretching north and south from Denver along the eastern edge of the Rockies—is growing rapidly, with newcomers from around the United States relocating to Colorado and, often to their surprise, finding themselves in the midst of a suburban oil and gas boom. What might these new residents, many of whom move to the state to enjoy its beautiful scenery, recreational opportunities, and sunny weather, think about rigs in the backyard?
Three Questions at the Front Range
A fast-growing body of literature has used surveys to assess what people think about the growth of oil and gas development in their communities. While the results of this work are nuanced, the research tends to find that individuals living closer to oil and gas development are more supportive than those who live farther away (controlling for other factors). The data also show, perhaps unsurprisingly, that political conservatives tend to be more supportive of the industry than liberals.
Our paper tests whether these two key themes identified from the literature pan out in the real world. We add a third question that’s particularly relevant for Colorado, namely: Are the residents of communities where drilling has increased the most—and who, in the case of Colorado with its newly relocated residents, may not have as much historical experience living near drilling rigs and the like—more or less supportive than other drilling communities?
We used precinct-level voting data from the state of Colorado and well-level oil and gas data from DrillingInfo (recently renamed Enverus) to examine the following three questions:
- How does industry support differ between voters living in communities with lots of oil and gas wells, compared to voters in communities with few or no wells?
- How does industry support differ between voters in Republican-leaning communities, compared to voters in Democratic-leaning communities?
- How does industry support differ between voters in communities where drilling has expanded most rapidly in recent years, compared to voters in communities with little change in drilling?
To be clear, when we say “industry support,” we are measuring the proportion of each precinct that voted either “Yes” or “No” on Prop112. Because a “No” vote blocks the imposition of new restrictions on oil and gas development, we take a “No” vote to indicate support for the industry, while we interpret a “Yes” vote as opposition to the industry.
What We Found at the Mountaintop
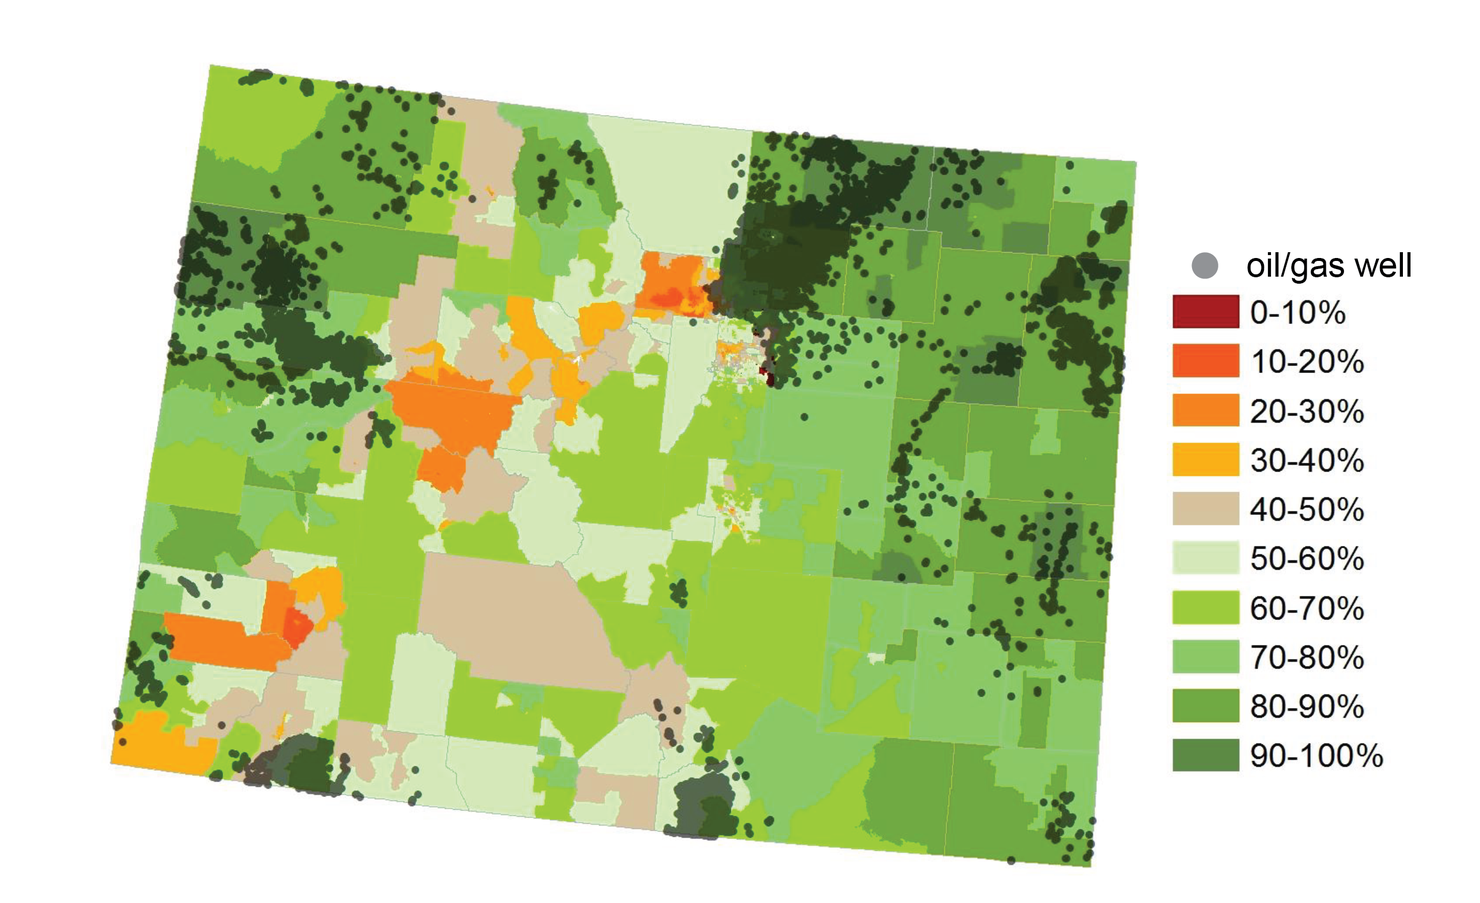
Most of Colorado’s oil and gas wells are in precincts that voted against Prop112 (i.e., these precincts were more supportive of the industry). Conversely, most precincts voting for Prop112 have little or no oil and gas activity (Figure 1).
Figure 1. Proportion of each Colorado precinct that voted “No” on Proposition 112.

Table 1 breaks these data down more precisely. It shows that the greater the opposition to Prop112 in a precinct, the more likely it was that voters in that precinct had oil and gas wells within their communities. In precincts that voted for Prop112 (i.e., were more opposed to the industry), fewer than four percent actually contained any oil and gas wells.
We find that for each additional oil and gas well per square mile in a given precinct, voter support for Prop112 declined by 0.74 percent. (This regression result, and all other regression results reported here, are statistically significant at the p<0.01 level.)
Table 2. Voter preferences and oil and gas activity.
| Proportion that voted “no” on Prop112 | Number of precincts (1) | Number of precincts with wells (2) | Proportion of precincts with wells (2)/(1) |
|---|---|---|---|
| 0-10% | 0 | - | - |
| 10-20% | 70 | 0 | 0% |
| 20-30% | 124 | 4 | 3% |
| 30-40% | 262 | 5 | 2% |
| 40-50% | 416 | 18 | 4% |
| 50-60% | 611 | 22 | 4% |
| 60-70% | 560 | 42 | 8% |
| 70-80% | 284 | 76 | 27% |
| 80-90% | 147 | 77 | 52% |
| 90-100% | 21 | 17 | 81% |
But what if, you ask, these voting patterns simply reflect partisan affiliation?
In other words, what if precincts opposed Prop112 because of their party affiliation (and related policy preferences), and those precincts also simply happen to host more oil and gas wells? What if proximity to oil and gas wells has less to do with voter stance on Prop112 than party affiliation?
Good questions!
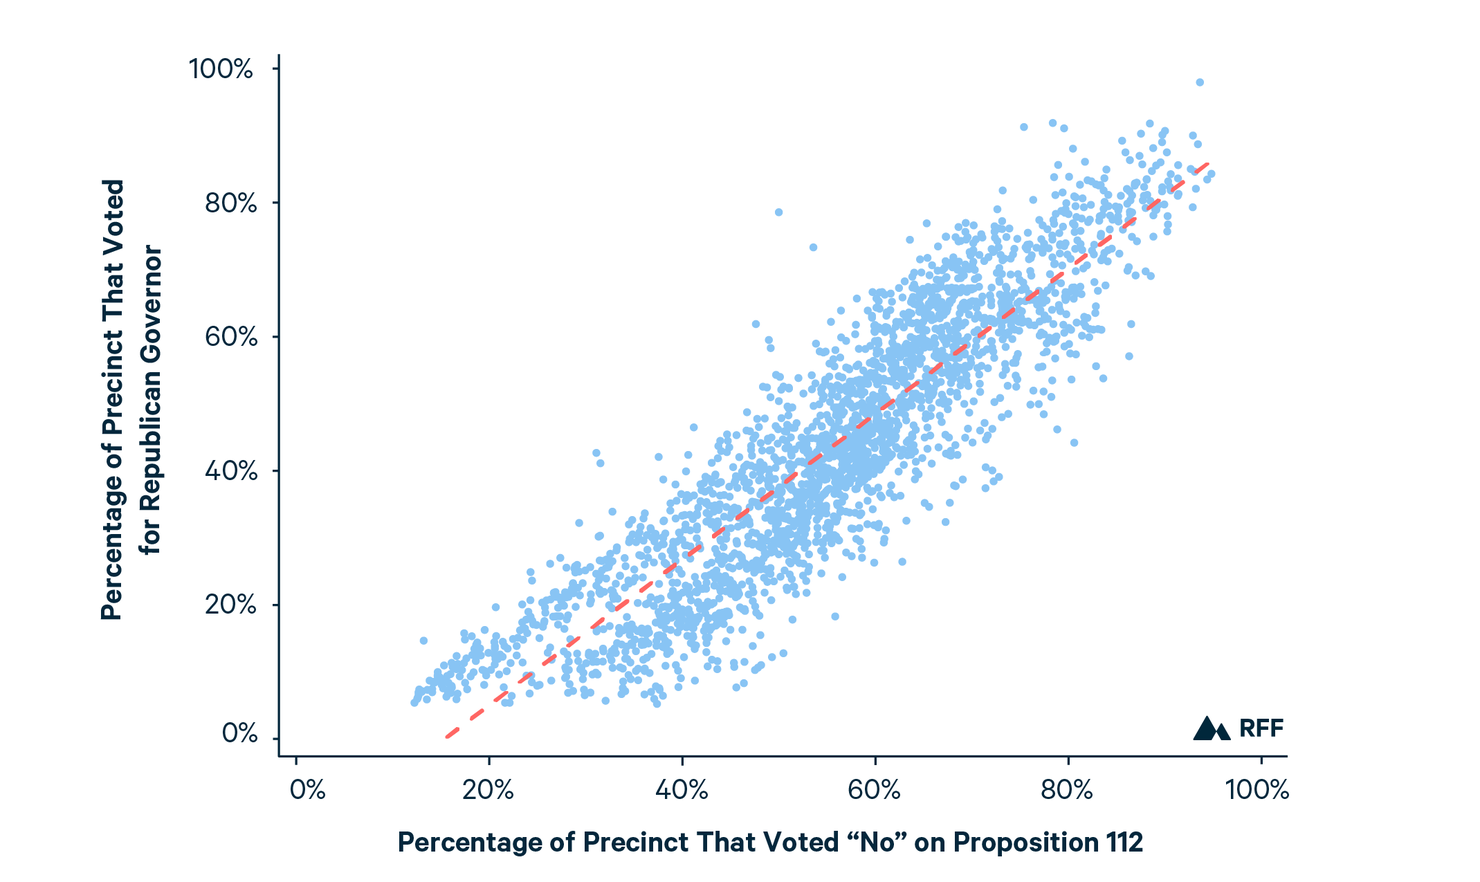
Most oil and gas drilling occurs in rural regions, which tend to be more conservative politically than urban areas. Indeed, we find an extremely close relationship between a precinct’s opposition to Prop112 and that precinct’s likelihood to vote for the Republican candidate for governor in that same November 2018 election (Figure 2).
Figure 2. Opposition to Proposition 112 and support for the Republican candidate for governor

When we test again to see whether the presence of lots of oil and gas wells in a precinct influences whether the precinct votes “Yes” or “No” to Proposition 112, this time controlling for each precinct’s vote for governor (i.e., the party affiliation of the precinct), the effect weakens considerably. With this control in place, we find that for each additional oil and gas well per square mile in a given precinct, voter support for Prop112 declines by just 0.2 percent—well below the 0.7 percent we observed without the partisan control in place. While 0.2 percent is a weaker result, it remains significant and suggests that even when we control for party affiliation, voters in precincts with more oil and gas wells are still more supportive of the industry.
Finally, what about precincts where drilling activity has increased the most in the shale era? When we include the growth in drilling activity in our analysis, we find that for each additional well per square mile installed between 2000 and 2018, support for Prop112 increases by 0.2 percent. This result is similar in magnitude—but opposite in direction—to the effect of living in precincts with lots of wells. It’s also not entirely surprising, as the most rapid growth in Colorado drilling has occurred alongside rapid urban and suburban growth along the Front Range. And, as we’ve noted, opposition to the industry has been vigorous in parts of the Front Range, with many residents eager to enjoy Colorado’s natural amenities—oil and gas wells not chief among them.
Summ(it)ing Up
In the end, we come to three major conclusions: (1) proximity to oil and gas development is associated with increased industry support; (2) this effect is weakened when we control for partisan preferences, which is a strong predictor of industry support; and (3) industry support is lower in areas where drilling activity has increased the most since 2000.
We should also note that political preferences are themselves proxies for other, more basic factors, and where wells are located is not entirely independent of political preferences (although correlations between these two variables are low). Sorting through these factors to make a more definitive statement about what drives individual votes on Prop112 would be a valuable next research step.
Colorado’s fight over oil and gas drilling has continued since the 2018 election and will likely continue in the years to come. As residents and lawmakers consider policy options going forward, we think it will be crucial for them to understand the complexities of whether the people most directly affected by industry activities—those whose backyards are home to drilling rigs, pump jacks, and the rest—want to see the industry grow or fade away.


