After major flooding, such as occurred recently in South Carolina, the news often reports that many victims of flooding were not insured. Analyses of take-up rates for flood insurance corroborate these news accounts, suggesting that, on average, roughly half of people in 100-year floodplains purchase flood insurance (see studies here, here, here, and here).
Since insurance can provide larger and timelier payouts to speed rebuilding after a disaster, it often seems surprising that more people living at risk of floods don’t purchase flood insurance. Previous work has suggested that individuals might be more likely to insure following a flood and that many insureds only keep their policies for a few years.
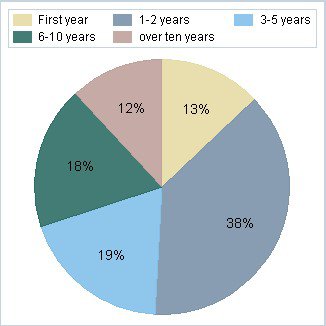
I recently took a look at policy duration among those people holding a flood insurance policy in 2012 from the National Flood Insurance Program (NFIP), the main provider of flood insurance in the United States. The pie chart below shows the percentage of policies by the number of years the policies have been in place. Note that a policy is specific to a person-property combination, so when someone moves, if the new owner purchases a policy, that is considered a new policy in the data.
Out of all single-family NFIP flood insurance policies in 2012, roughly 13 percent were just purchased that year. The largest share of policies, roughly 38 percent, had been purchased only in the last year or two. That said, close to 30 percent of policies had been in place for over 6 years. Some policyholders, contrary to popular belief, are holding their policies for a long time.
NFIP 2012 Policies by Length of Tenure


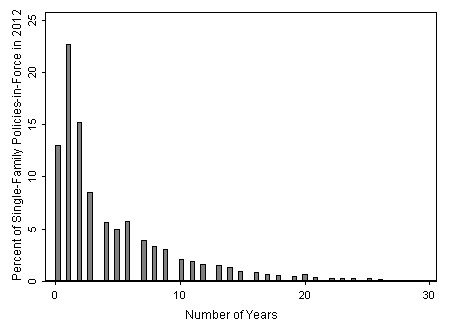
Of course, part of the observed pattern reflects people moving. This would explain the general downward trend in the histogram above. But is there anything that differentiates those who have kept their policies for a long time from those who have not? The NFIP data are not particularly well suited to help answer this question because they do not include information on who dropped a policy because of a move and who dropped it because of a decision not to insure anymore. Still, a few interesting findings emerge.
One hypothesis is that homeowners who keep their policies longer are those subject to (and complying with) the requirement for homeowners in 100-year floodplains to purchase flood coverage if they have a mortgage from a federally backed lender. When we look at the number of years policies have been in place by flood zone, we find that in the 100-year floodplains, a much greater percentage of policies have been in place over 6 years: just under 35 percent for inland 100-year floodplains and 41 percent for those subject to storm surge, whereas outside the 100-year and 500-year floodplains, the percentage is only roughly 23 percent. Flipping this around, policies that have been in place longer are disproportionately located in higher-risk flood zones. For properties bought in 2012, half were in the high-hazard areas defined as FEMA-mapped 100-year floodplains. This increases with the tenure of policies until, for those that have been in place over 10 years, roughly 72 percent are in mapped 100-year floodplains.
The longer retention of these policies is likely motivated by the combined forces of the mandatory purchase requirement and the higher risk of flooding in those areas. That is, it seems, sensibly, that those most at risk and/or subject to legal requirements are the ones holding on to their flood coverage.
When we look at the average premiums by flood zone and policy tenure, we see the median price is quite similar across all classes. The mean premium for the 100-year floodplain, however, is lower for those policies that have been in place for over 10 years. This could be explained by a disproportionate share of those properties with policies over 10 years being “pre-FIRM” (pre-Flood Insurance Rate Map)—that is, built before flood risks were mapped in a community and thus historically given lower rates. Indeed, for those policies in place over 10 years, 55 percent are pre-FIRM, compared to only 46 percent for all other lengths of tenure. So it also seems to be the case that those homeowners with preferential rates keep their policies longer.
One question is whether these homeowners will continue to hold on to their policies if they lose their preferential rates. Reform legislation adopted in 2012 and 2014 is phasing in higher premiums for these (and other) properties. The past few years, the number of policies in force around the country has also declined, leading to speculation that this is due to the new rates. However, annual NFIP statistics show that the decline in policies appears to have begun in 2010, before the legislative changes, falling from a high of 5.7 million policies nationwide in 2009 to 5.35 million in 2014. It is challenging to isolate a price elasticity for flood coverage (that is, how responsive take-up rates are to prices) because data are not available on the rates of those without coverage and price is so tightly correlated with risk—but this information would be quite useful to policymakers.


