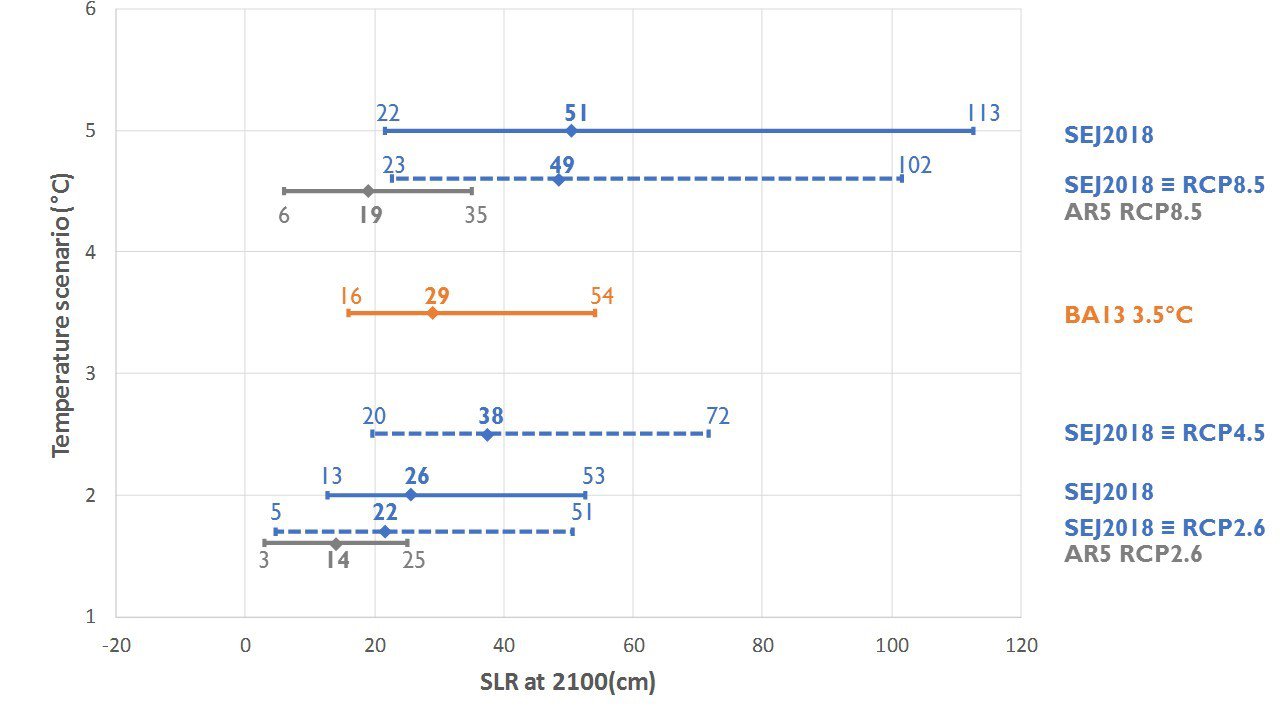
The title of Eugene O’Neill’s 1939 noir epic on man’s need for self-deception could be the chyron for a recent article in the Proceedings of the National Academy of Sciences (PNAS) entitled "Ice Sheet Contributions to Future Sea Level Rise from Structured Expert Judgement" by J.L. Bamber, M. Oppenheimer, R.E. Kopp, W.P. Aspinall, and R.M. Cooke. Many recent publications warn of ice sheets’ growing instability (here, here, and here, for example). The PNAS paper describes a structured expert judgment uncertainty quantification of ice sheets’ contribution to sea level rise (SLR) out to 2300 under +2°C and +5°C stabilization scenarios. Expanding on the methodology of Bamber and Aspinall’s groundbreaking 2013 study, the PNAS study again treats individual experts as testable statistical hypotheses, but this time, it targets upper-tail dependence between ice sheet processes. The result is higher median assessments and expanding uncertainties, especially in the upper tail, relative to the Fifth Assessment Report of the United Nations Intergovernmental Panel on Climate Change (IPCC AR5). Figure 1 shows AR5’s “likely” range of 17th, 50th, and 83rd percentiles of ice sheet’s contribution to sea level rise in 2100 under the Representative Concentration Pathway (RCP)8.5 concentration pathway and compares those with the PNAS study, adapted to the RCP8.5 temperature trajectory (SEJ2018 ≡RCP8.5). The median 49cm (PNAS) contrasts sharply with 19cm (AR5), while the 83rd percentile 102cm (PNAS) dwarfs 35cm (AR5). An attenuated increase is found with respect to Bamber and Aspinall (2013). Due to IPCC’s focus on “likely” ranges, comparisons of 5th and 95th percentiles are not possible.
Figure 1. Median and Likely Range (17-83rd percentile as used in the AR5) Estimates of the Ice-Sheet SLR Contributions for Different Temperature Scenarios and Different Studies

BOGSAT and Beyond
The contrasts in the above figure are as much about method as about numbers. The BOGSAT (bunch of guys/gals sitting around a table, 1961) approach reigns at the IPCC for uncertainty quantification. Its calibrated uncertainty language, in the form of Kent charts (1964), was eventually adopted by the US Defense Intelligence Agency in 1976, only to be abandoned a few years later for lack of validation: “there is no indication that estimates which are ‘70 percent probable’ have been tested to determine that they were correct 70 percent of the time” (Morris and D’Amore p. 5–26).
People sitting around a table vectored to agree on an uncertainty characterization will easily focus on “likely” regions of the uncertainty space at the expense of “unlikely” regions where consensus is more difficult. Risk analysts, however, must survey the full distribution of possible outcomes from Pollyanna to Chicken Little. It is sobering to realize how large the uncertainties are. For the +5˚C stabilization scenario in 2300, the performance weighted combination of experts has a 90 percent confidence range of minus 9 cm SLR, due to ice sheet contributions, to +9.7 meters. Even under these conditions, it is possible—not likely but possible—that the ice sheets will lower the sea level by at least 9cm. It is equally likely that they will raise the sea level by at least 9.7 meters (these numbers are relative to sea level between 2000 and 2010 and exclude a 0.76mm/yr SLR baseline adjustment since pre-industrial times, which is present in Figure 1).
The structured expert judgment method applied in the PNAS study features traceable individual elicitations of highly vetted experts quantifying their 5th, 50th, and 95th percentiles for uncertain quantities. In addition to the variables of interest, these include variables from their field, the true values of which are known post hoc. This enables testing the hypothesis that an expert is statistically accurate—that is, statistically, 5 percent of the true values fall beneath the expert’s 5th percentiles, 45 percent fall between the 5th and 50th percentiles, etc. In comparable studies, about 40 percent of experts, regarded as statistical hypotheses, would not be rejected at the 0.01 level—the same percentage as in the PNAS study. The reality is that experts are not trained in probabilistic assessment, and the majority does not perform these tasks well. Combining experts based on their performance has been shown superior to simple equal weighting both in-sample and out-of-sample.
Consensus versus Risk
Is society facing a problem of deciding under consensus or deciding under risk? The author’s recent public lecture at the Risk Center at the ETH Zurich showed how the consensus approach ensnares us in a Confidence Trap and has allowed the deniers to frame the climate debate: those favoring climate action are challenged to prove that human-caused climate change is real. This challenge is a fool’s errand that must never be accepted. In the same vein, if ice sheet growth is possible, you can’t prove it isn’t possible. The relevant question is, what should we plan for in light of the uncertainties? The PNAS study takes a position on this with respect to sea level rise in 2100:
“We find that, since the AR5, expert uncertainty has grown, in particular, due to uncertain ice dynamic effects . . . . For a 5°C temperature scenario more consistent with unchecked emissions growth, the [median and 95th percentile] values are 51 cm and 178 cm, respectively. Inclusion of thermal expansion and glacier contributions, results in a total SLR estimate that exceeds 2m at the 95th percentile. Our findings support the use of scenarios of twenty-first century total SLR exceeding 2m for planning purposes.”


