After more than a year of lockdowns, some expect car travel to increase dramatically this summer. But the data present a more complex picture of future demand for gasoline.
Warmer weather, wider availability of vaccines, and the end of the school year have many of us thinking about summer vacation. The resulting projected rise in gasoline demand has prompted speculation about bottlenecks in gasoline supply and shortages at gas stations—of which the recent Colonial Pipeline hack gave us a taste. But some naysayers have argued that any disruptions from increased demand will be short lived. Many point out that major employers are considering allowing staffers to work from home permanently, which would prevent gasoline demand from returning to pre-pandemic levels.
So, which is it? Will gasoline demand return to pre-pandemic levels this summer and stay there, or will demand remain lower than usual? We’ll probably have to wait until the fall to learn the long-term effects of the pandemic on gasoline demand, but data from the US Energy Information Administration (EIA) provide a good starting point for understanding near-term effects.
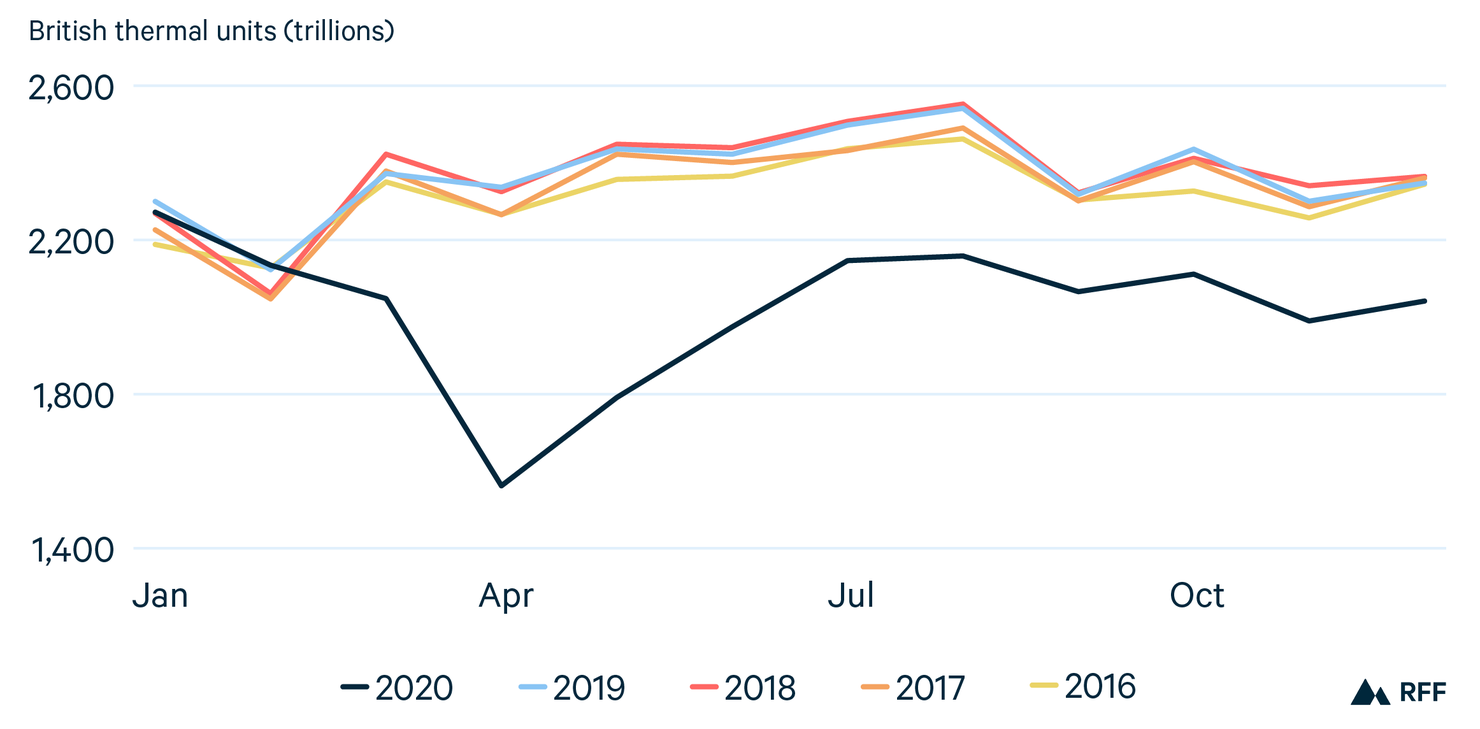
Figure 1 compares monthly transportation energy consumption from 2016 to 2020. In March through December of 2020, consumption was 17 percent lower than the average of prior years.
Figure 1. Total Monthly Transportation Energy Consumption (2016–2020)

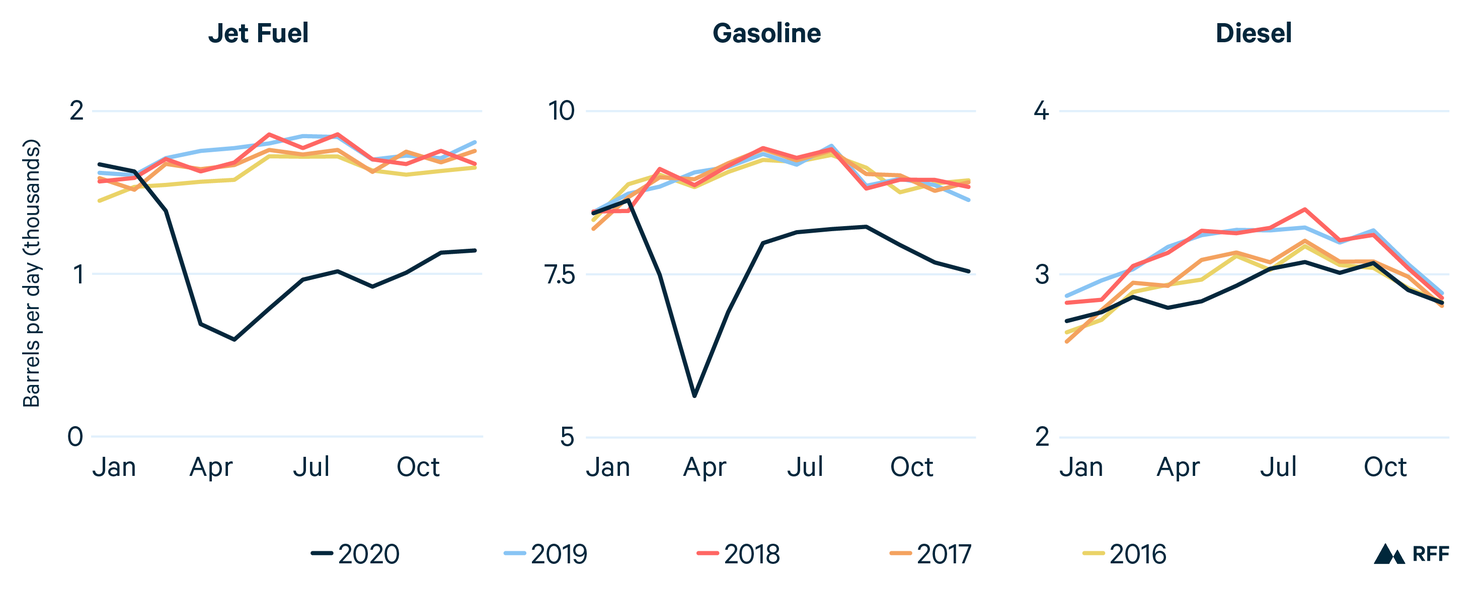
Figure 2 shows monthly fuel consumption for the three main fuels used in transportation: jet fuel, gasoline, and diesel fuel. Not surprisingly, jet fuel and gasoline account for most of the overall decrease in transportation energy consumption, with fewer Americans traveling to work or embarking on nonessential trips. Interestingly, diesel fuel consumption wasn’t any different in 2020 than in prior years: commercial trucks consume the vast majority of diesel fuel in the United States, and even though some business activity has slowed, the increase in shipping from online shopping has more or less offset that decline.
Figure 2. Total Monthly Consumption of Major Transportation Fuels (2016–2020)

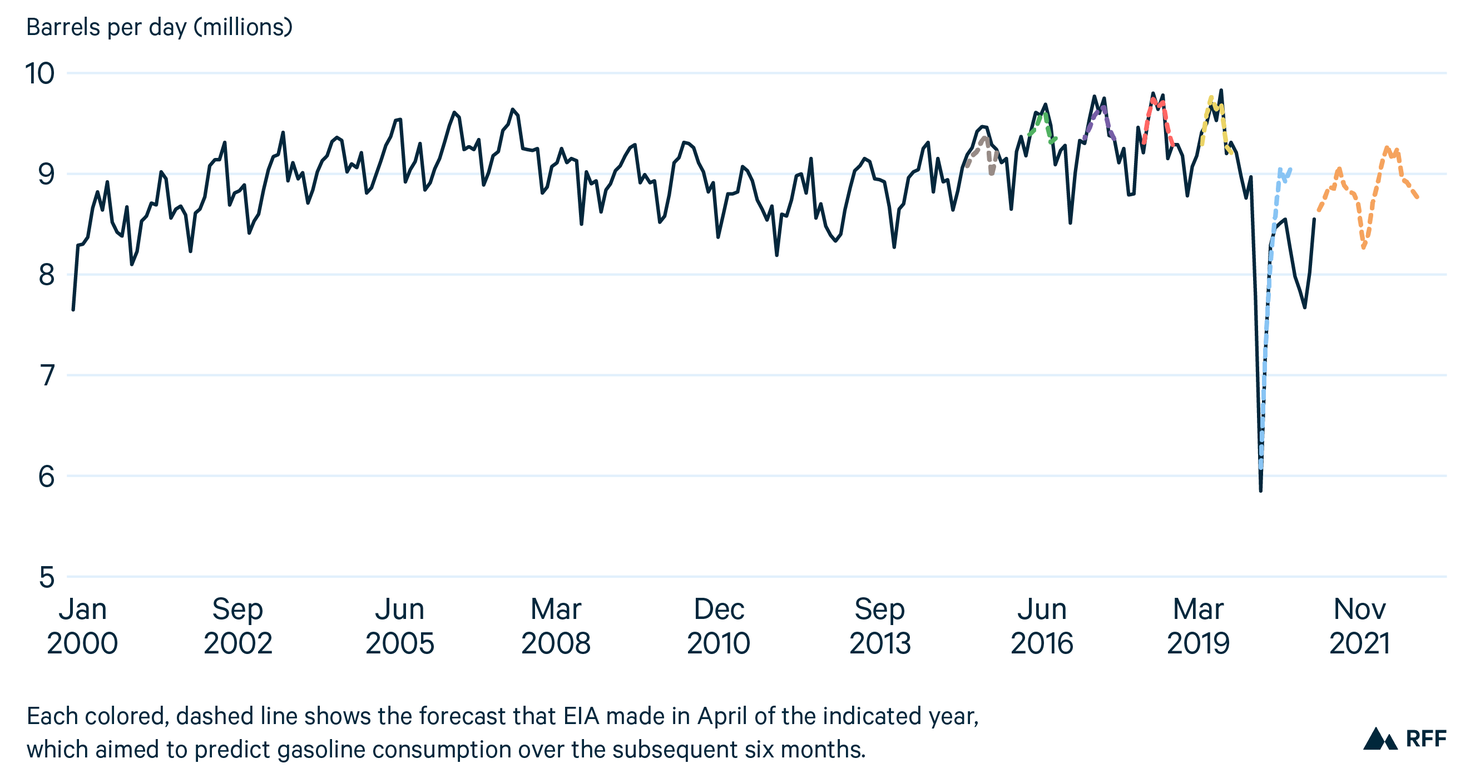
What does the recent past tell us about the near future? Each month, EIA forecasts near-term energy demand in its Short-Term Energy Outlook. Figure 3 shows historical data that focus on gasoline consumption (which accounts for more than half of total transportation consumption), using the amount of product supplied as a proxy for consumption. Gasoline consumption trended up through 2008, dipped during the recession and aftermath, then continued rising in the late 2010s. Seasonal patterns are evident, along with a major break from the recent historical upward trend when the novel coronavirus started to spread in 2020.
Figure 3. Monthly Gasoline Consumption (2000–2021) and Near-Term Forecasts

Each non-blue line shows the forecast that EIA made in April of the indicated year, which aimed to predict gasoline consumption over the subsequent six months. For example, the yellow line shows the forecast that EIA made in April 2019 for consumption between April and October of that year. It’s not an accident that the non-blue lines overlap very closely with the blue line; the forecasts have been accurate, typically within about 1 percent of actual consumption. The April 2020 forecast for summer consumption was less accurate, which isn’t surprising, given that EIA was forecasting in March 2020, when the trajectory of the COVID-19 pandemic was unclear.
The orange line shows the forecast EIA made in April 2021. EIA forecasts a recovery this summer, but still expects consumption to fall below pre-pandemic summer levels. Given the historical accuracy of EIA’s April predictions, I would put a lot of stock in that forecast, although EIA may be underestimating future gasoline demand if news articles are right about pent-up demand for summer travel.
I suspect that any spike in demand will have worked itself out by the fall. By then, assuming schools are teaching students in person, families with kids won’t be traveling as much, and businesses will start implementing plans related to long-term shifts that favor remote work. To get a sense of the potential implications of working from home on gasoline consumption, keep in mind that commuting accounts for about 30 percent of total vehicle miles traveled by households. Therefore, if employees reduce commuting by one day per week on average (some more, some less), total gasoline demand would fall by 5–10 percent—hardly an earth-shattering figure, but enough to noticeably cut congestion and greenhouse gas emissions.
Some of my previous research has demonstrated a very tight connection between employment and gasoline consumption, during both economic slowdowns and periods of rapid economic growth. That connection has persisted over many decades and across generations of drivers. By the fall this year, we should know whether the pandemic has weakened the connection.
The disruption of the Colonial Pipeline raises broader questions about oil supply. If future demand differs markedly from expectations, we might see greater volatility in global oil markets—and hence, gasoline prices—as supply adjusts. Given how much the pandemic is making us reconsider travel choices, massive swings in gasoline prices may provide further impetus for consumers to reduce gasoline consumption.
This article also appears on the University of Maryland’s Transportation Economics and Policy Blog, which is supported in part by funding through the Maryland Transportation Institute.


