With the US Treasury Department soon expected to decide how to implement the so-called “45V” tax credit for clean hydrogen fuel production, Resources for the Future Fellow Aaron Bergman reviews the research to date on the implementation of the credit.
The new 45V tax credit for hydrogen production in the Inflation Reduction Act is a big deal, with potentially billions of dollars at stake to jump-start a domestic hydrogen-fuel industry. Given the amount of money involved, it’s understandable that a lot of disagreement has arisen over the right way to implement the tax credit, particularly with respect to the consumption of clean electricity for splitting water into oxygen and hydrogen fuel, a process called electrolysis. Perhaps coming as a surprise to the people who wrote the Inflation Reduction Act, the implementation of 45V has raised many complex and relatively novel issues. I’ve worked previously with colleagues on an overview of the 45V tax credit and a deeper dive into the effect on emissions of 45V and other issues discussed here.
Much of the discussion on 45V has been informed by a set of recent studies put forward by multiple research groups. Today, I’m introducing a series of issue briefs that compare these studies and explore what drives their key results. We argue that the central driving factor is whether the model used in the study is allowed to choose what type of new power generation—clean or emitting—is built to meet the new load from electrolyzers or, instead, if the new power generation is assumed to be clean.
The fundamental question confronting 45V implementation is how an electrolyzer can claim to consume clean electricity and therefore be eligible for the tax credit. Policy proposals generally start with a clean generator that produces a certificate known as an energy attribute credit (EAC) for every unit of clean power generated. The generators then can sell these EACs to electrolyzers as a demonstration of clean electricity consumption. The studies discussed here explore the consequences of two different approaches for using EACs, referred to as “annual matching” and “hourly matching.” In annual matching, an EAC can be used to demonstrate the consumption of clean electricity at any time of the year, while in hourly matching, the EAC can be used only in the same hour that the associated clean power was generated.
In this blog post, I will examine the effect of these two approaches on the resulting emissions and on hydrogen prices, as considered in the following five studies:
- A1: “Minimizing emissions from grid-based hydrogen production in the United States” by the Princeton ZERO Lab
- A2: “Producing hydrogen from electricity: How modeling additionality drives the emissions impact of time-matching requirements” by the MIT Energy Initiative
- A3: “45V Hydrogen Production Tax Credits: Three-Pillars Accounting Impact Analysis” by Evolved Energy Research
- B1: “Analysis of Hourly & Annual GHG Emissions: Accounting for Hydrogen Production” by Energy + Environmental Economics and the American Council on Renewable Energy
- B2: “Green Hydrogen: An assessment of near-term power matching requirements” by Boston Consulting Group
We have divided the studies into two groups, (A) and (B), based on their approach to the deployment of clean energy. Each study examines multiple scenarios. For this initial blog post, I present the differences across scenarios regarding emissions and hydrogen prices for each study when comparing annual matching with hourly matching. The group (A) studies also include deliverability requirements, which restrict where EACs can come from, and additionality requirements, which require the EACs to come from “new” sources. Here, we focus on emissions and hydrogen costs, because the trade-off between these two variables perhaps is the most central policy consideration for the 45V tax credit. Please see some of my previous work for more discussion on the trade-off between costs and emissions for the hydrogen tax credit and the effects on emissions of differing 45V crediting approaches.
Comparing the Studies
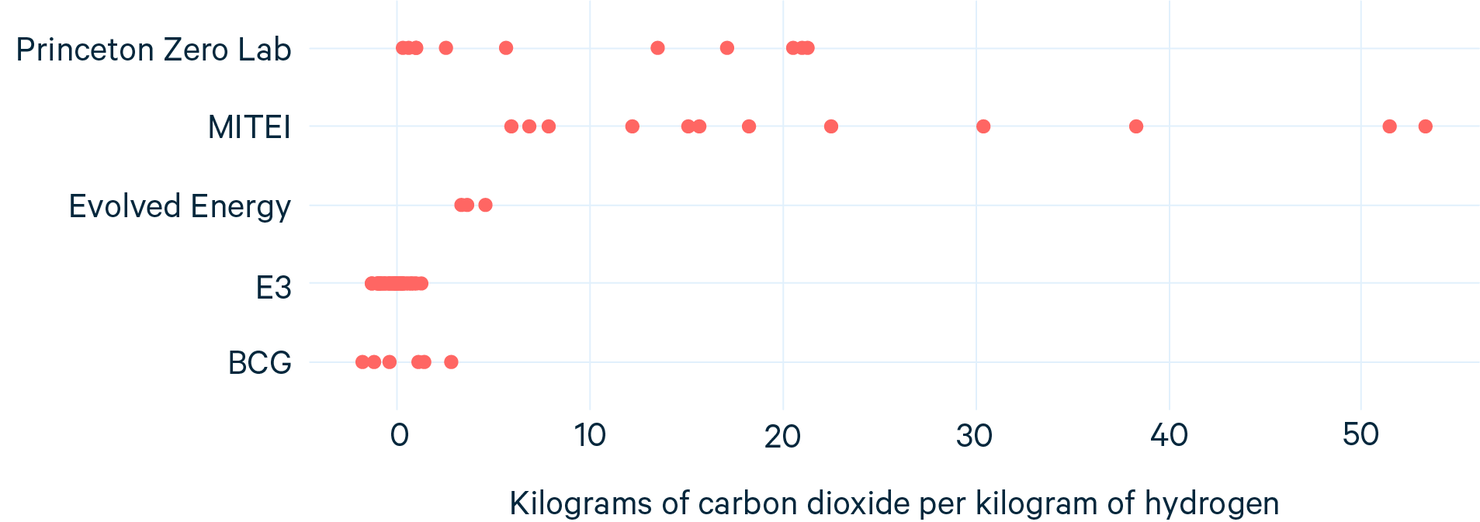
Starting with emissions, the group (A) studies all show that annual matching results in higher emissions than hourly matching, while the group (B) studies have scenarios with both higher and lower emissions (Figure 1). This difference in results is because these papers make fundamentally different assumptions. The group (A) studies ask (and answer) which new type of clean energy is most economical to deploy in response to the demand for electricity that converts water to hydrogen and the imposition of either an hourly or annual matching requirement. In contrast, the group (B) studies assume that new clean energy—rather than some mix that includes emitting power generation—is being built to meet the new demand for electricity.
Figure 1. Emissions from Annual Matching Minus Emissions from Hourly Matching across Scenarios

Notes: “MITEI” represents the paper by the MIT Energy Initiative and shows the “compete” scenarios, estimated from Figures 4 and 6. “Evolved Energy” shows the difference between “three pillar” and “limited requirements” scenarios. “E3/ACORE” represents the paper by Energy + Environmental Economics and the American Council on Renewable Energy and is estimated from Figure 12. “BCG” represents the paper by the Boston Consulting Group and shows the national average emissions for scenarios A and B.1–B.5 (assumes hourly matching produces zero emissions).
The most important determinant of emissions is the type of electricity generation that is built to meet the new load from the electrolyzer. If natural gas is built to meet the new load, then the emissions will be relatively high. On the other hand, if clean electricity is built, then the emissions will be lower (but not necessarily zero). In the absence of requirements on electrolyzers, a combination of clean and emitting generation likely would be built to meet the new loads, which likely would result in emissions that are higher than the emissions from existing hydrogen production with natural gas.
If one wants all clean electricity to be built, then someone has to pay for it. The purchase of EACs from clean generators is one way for electrolyzers to fund new clean generation (and, from the point of view of the modeling, effectively would be the same as the use of power purchase agreements). For example, in the study by the Princeton ZERO Lab, the EAC prices are higher in the hourly scenario than in the annual scenario; in the annual scenario, the prices are zero. As a result, more clean electricity is built and less carbon dioxide is emitted in the hourly case.
Because group (B) studies simply assume that new clean generation is built to meet the new electrolyzer load, these studies sidestep the question of what kind of power generation is built. Instead, any emissions differences arise due to the clean generation and electrolyzer being operated at different times and locations and the amount of overbuild assumed in the given scenario—where overbuild means that more clean energy than needed is built to meet the annual electrolyzer load, either to ensure sufficient clean generation in a given hour or to reduce overall emissions. The emissions differences in these studies generally are smaller than in the group (A) studies.
Comparing the two modeling approaches yields the conclusion that letting the model decide what type of generation will be built, rather than assuming that the answer will be 100 percent clean generation, is more defensible. Letting the model decide is especially important, as the nature of the power generation built is the most important driver of emissions differences between the two crediting approaches.

These results have important and significant sources of uncertainty, however. For example, the EAC prices, which help drive the deployment of new clean power generation, arise from the balance of supply and demand for clean electricity, which in turn depends on how much clean electricity will be available in the future. If less clean electricity ends up being built, for example, then EAC prices could be higher in the annual-matching scenario, which would reduce the difference in emissions between hourly matching and annual matching.
The studies also don’t account for corporate clean energy procurement as a source of demand for EACs, which could increase EAC prices. Ultimately, knowing whether or not a unit of clean energy really represents new clean energy is complicated—whether the energy comes from an EAC or through a contract such as a power purchase agreement.
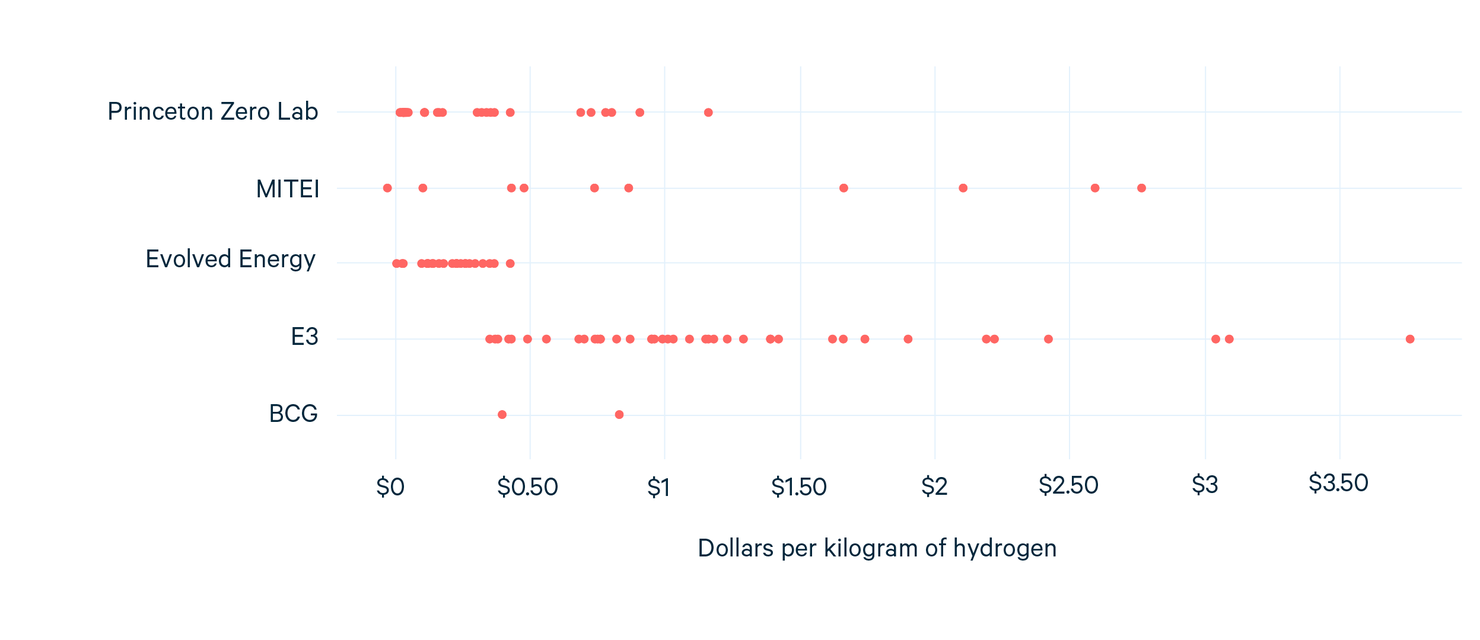
The difference in the levelized cost of hydrogen—the price at which an electrolyzer can sell hydrogen and recover its costs—for the annual-matching and hourly-matching policies is shown in Figure 2. In the group (A) studies, the different generation built with hourly matching and annual matching is a major driver of the price difference. In the paper by the MIT Energy Initiative, another major driver of hydrogen cost is whether or not the electrolyzers can use storage to operate flexibly, which can reduce costs substantially. In the group (B) studies, however, the new capacity is assumed to be clean in both scenarios.
In all the studies, an overbuild of renewables could lead to additional costs.
Finally, in all these scenarios, electrolyzers can have differing capacity factors, meaning that the electrolyzer runs more or less often. When an electrolyzer runs less, it sells less hydrogen and needs to charge more for the hydrogen it produces to be able to recover its capital expenses.
Figure 2. Levelized Cost of Hydrogen in Hourly Matching Minus Levelized Cost of Hydrogen in Annual Matching across Scenarios

Notes: MITEI represents the paper by the MIT Energy Initiative and shows data from “compete” scenarios. “Evolved Energy” is the difference between “three pillar” and “limited requirements” across all regions (estimated). “E3/ACORE” represents the paper by Energy + Environmental Economics and the American Council on Renewable Energy and shows the range of price increments in their emissions matching scenarios. “BCG” represents the paper by the Boston Consulting Group and shows the range from the “maturing market” scenario (estimated) in slide 17.
The estimates for the levelized cost of hydrogen depend on a number of uncertain quantities, including the cost of new generation, electricity prices, and the demand for hydrogen. An additional source of uncertainty comes from unmodeled requirements. For example, significantly stricter deliverability requirements could lead to siting inefficiencies and increased costs.
While the major driver of the differences among these studies is how the models treat new power generation, the results differ widely in other ways—which in turn highlights the challenges involved with implementing the tax credit.
To Be Continued
In the subsequent issue briefs in this series, I will dig a bit deeper into these five papers. Next, I will look at the papers by the Princeton ZERO Lab and the MIT Energy Initiative, as these papers employ very similar methodologies. Then, I will look at the paper by Evolved Energy Research, which is unique in that the amount of hydrogen generated is a modeled output rather than an input. Finally, I will look at the paper by Energy + Environmental Economics and the American Council on Renewable Energy, alongside the paper by Boston Consulting Group, which consider the emissions and costs under the assumption that the needed clean energy is built.

A previous version of this article stated that future entries in this series would be blog posts. Instead, these entries have been published as issue briefs in a series called 45V Hydrogen Tax Credit in the Inflation Reduction Act:
- Comparing Hourly and Annual Matching
- Incorporating the Demand for Hydrogen
- The Role of New Clean Electricity
Editor’s note: A previous version of Figure 2 in this article included slightly higher values for the levelized cost of hydrogen that are projected by the Boston Consulting Group (BCG); these values have been corrected.


