In 1962, the Outdoor Recreation Resources Review Commission, in its report to the Congress and to the nation, noted:
"The most striking aspect of the supply of outdoor recreation resources in America is one of paradox. Public areas designated for outdoor recreation include one-eighth of the total land of the country. Millions of other acres, private as well as public, are also used for recreation. But this apparent abundance in many ways fails to provide an adequate supply of outdoor recreation opportunities for the public. The problem is not one of number of acres but of effective acres—acres of land and water available to the public and usable for specific types of recreation. For reasons of location or management, much of the vast acreage nominally designated for recreation is not now available for general public use. Most of this land is in the mountains of the West and Alaska, while a large percentage of the people are in the East. This kind of imbalance often is duplicated within states. Michigan has a vast recreation resource in public ownership, but most of it is located just beyond the range of mass recreation use for the people of Detroit. The pattern is repeated elsewhere."
Since gross or surface acres are a poor measure of land area actually usable for outdoor recreation, some unit that measures or approximates effective acres would be very useful for analyzing outdoor recreation problems and opportunities. The purpose of this article is to outline such a measure—Effective Acreage Equivalent—that is, in a sense, analogous to British thermal units, barrels of oil, tons of coal, or other measures by which different kinds of energy are calculated on a common base. Such an overall base helps greatly in summarizing disparate kinds of information but, of course, it cannot reflect all the nuances and different attributes of the items that enter into the summary measure.
Demand for the outdoor recreation experience
An analysis of Effective Acreage Equivalent can best begin with a consideration of the demand for the whole recreation experience, which consists of five phases: anticipation, travel to site, on site, travel back, and recollection. And each phase has three dimensions: physical, economic, and psychological. One can thus imagine a matrix, with the five phases running vertically down the stub of the table and the three dimensions as columns across the table. In the first box are the physical aspects of anticipation: securing and testing gear, purchasing supplies, planning routes, packing of the gear and supplies into the station wagon, and so forth. The second phase of the physical dimension includes the actual transportation process, including refueling of the vehicle, meals en route, overnight accommodations for longer excursions, and perhaps cursing at traffic jams. On-site activities are numerous and varied, of course, and travel back is similar to travel to, in the physical sense. Recollection may be aided by souvenirs or other artifacts, including color slides.
The attitudes with which persons contemplate the recreation activity, both before and after it, and with which they view the travel dimension and the onsite activities determine the net balance, emotionally, of the whole experience. Attitudes need not conform to reality—larger fish may be caught in the living room than on the lake! Some of the attitudes may be simple dreaming—hopes or fears that reality will reveal as not soundly based—but their effects are nonetheless real at the time.
Each of the physical activities has its economic counterpart—spending for various goods and services, with the usual concern for getting the best value for the money and the usual relationship of wants exceeding available funds. Since deriving the Effective Acreage Equivalent depends on these economic relationships, the rest of this article concerns only economic factors and relationships. The reader should realize, however, that the physical and psychological dimensions also exist and that, indeed, they can be extremely important.
A hypothetical demand curve
Assume an outdoor recreation area—park, lake, forest, or whatever—of the mediate type, meaning one suitable for day use but too far away to be used after work or after school, and not attractive enough for most people to wish to spend a vacation there. One good example of this kind of area would be an artificial reservoir, of no great attractiveness but with good fishing, located some miles from the nearest town or city.
Studying the actual use of such areas yields a demand curve or relationship for the whole recreation experience (see table 1 and figure 1). For people living within 10 miles of the reservoir, the cost per recreation experience is $10, assuming no admission charge is made and no user charge is collected. This $10 includes the cost of operating the automobile, the cost of fishing and other gear, the cost of food, and other miscellaneous costs, but no allowance for the value of the time of the recreationist (probably most people would regard the travel time and inconvenience as a cost, but some might enjoy the travel as much as the on-site activity). Those who live close to the reservoir might make perhaps 70 fishing visits per 1,000 population during the year. This number would depend on many factors, including climate, income of the population, interest in fishing, and the attractiveness of other recreation possibilities.
Residents of the next zone outward from the hypothetical reservoir recreation area average the same in age, sex, income, interest in fishing, and other personal characteristics, as do their counterparts in the closest zone. The only difference is that now it costs $20 per recreation visit for the same items. With this higher cost, the number of visits per 1,000 population falls off to 44. For persons in the third zone—21 to 30 miles away, and subject to all the foregoing assumptions—the number of visits would be 28 per 1,000 population, at an average cost of $30 per visit. And so on down the first column of table 1 and on the line in figure 1. When the one-way distance exceeds 50 miles and the cost of the recreation visit is $60 or more, no one will find it worthwhile to visit such an area. Under the assumption of no user charges, the total number of recreation visits in a year would be 165 per 1,000 population.
The data in table 1 and figure 1 are for visits, not for visitors; that is, each person is counted each time he or she visits the area. Most people do not visit this area at all, as the data clearly show: the total number of persons visiting the area could not exceed 165 and probably falls far short of this maximum number.
Some of the visitors, for at least some of their visits, would accept considerably higher costs per visit rather than forego the recreation experience. For example, while 70 visits are made from the near zone when the total cost is $10, if the cost per visit were doubled to $20 through an entrance fee or user charge or for any other reason, the number of visits would fall off to 44—the same as when total costs are $20 without any admission or user charge. The effect of different charges on numbers of visits from different zones of origin is shown in table 1.
If every visit could somehow be charged an amount exactly equal to its value to the user, a total revenue of about $2,200 would be possible. This sum measures the consumer surplus for all users for all visits when the user charge is set at zero. The supplier of the recreation area may incur some costs in making the area available but, when user charges are administratively set at zero, all these costs must be borne by the supplier and all the consumer surplus accrues to the consumers.
If user charges were imposed, the number of visits would decline, as we have seen in table 1. The amount of revenue that would be raised by different charges—but equal charges for all visits—is shown in figure 2. If a single price is charged for all visits, then a charge of about $14 would yield the maximum revenue. Up to that charge, increased revenue per visit more than offsets decreased numbers of visits, and total revenue rises; above that charge, on the other hand, decreased numbers of visits reduce revenue more than increased charge per visit increases it. At this maximum revenue charge, there would be about 82 visits, which at $14 per visit would yield about $1,150, or only slightly more than half of the revenue generated if every visit paid its maximum value (as estimated previously). Some form of a two- or three-price system might yield a little more revenue. For instance, higher charges might be imposed on weekends than on weekdays.
The data in table 1 and the figures 1 and 2 include no consideration of the costs of supplying the recreation opportunity, hence they do not indicate the level of charges and visits that would yield the maximum profit (or the minimum loss) to the owner/manager of the area, whether private or public.
Table 1. Number and Cost of Visits to a Hypothetical Recreation Area
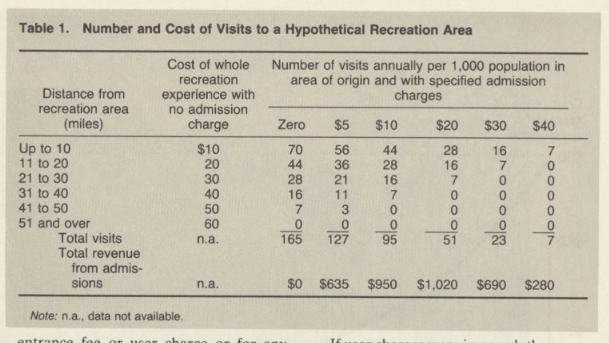
Figure 1. Number and cost of visits to a hypothetical recreation area
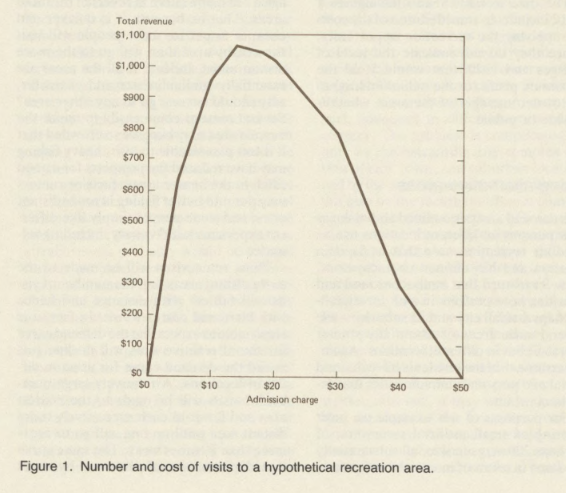
Figure 2. Total revenue from varying admissions charges to a hypothetical recreation area (single price system)
Using alternative areas
The demand analysis outlined above shows how persons in different locations use an outdoor recreation area that is fixed in location and has defined characteristics. Now let us turn that analysis around and consider how persons in one location—perhaps a small city and its suburbs—use several such areas of essentially similar character but in different locations. Again, we assume that the residents have defined social and personal characteristics that remain constant.
For purposes of this example we posit a string of small artificial reservoirs, of perhaps 200 acres in size, all substantially the same in terms of innate attractiveness, but each located 10 miles farther from the city than the last. The main attraction of these reservoirs is fishing, with perhaps a picnic lunch on shore, but they have no overnight facilities. We can readily envisage a "demand curve in reverse" for these areas. That is, because it is quicker and cheaper to get to, more people will visit the nearby area than will go to the more distant areas. Indeed, if all the areas are essentially similar in size and character, why should anyone go to any other area? Several reasons come easily to mind: the nearest area may become so crowded that it is less pleasurable to visit; heavy fishing may have reduced the prospects for a good catch in the nearby areas; facts or rumors may point to better fishing in more distant ones; and some people simply like different experiences and variety, including solitude.
Thus, some visits will be made to the more distant areas, but the number of visits will fall off with distance and hence with increased cost per visit. In fact, it is reasonable to expect that the demand curve for the alternative sites will decline just as did the demand curve for users in different locations. A relatively large number of visits will be made to the nearest area and fewer to each successively more distant area until no one will go to areas more than 50 miles away. The same curve that depicted use of one area by users located at different distances from the site now becomes the curve for use of different areas by persons located in one area.
Defining Effective Acreage Equivalent
For this chain of artificial lakes, let us assume that the closest area becomes the standard for defining effective acreage, and reduce the others to an Effective Acreage Equivalent in terms of their relationship to the nearest area. Thus, the 200-acre reservoir within 10 miles of use is equal to 200 acres of effective outdoor recreation area. The next 200-acre reservoir, 10 miles farther away, is equivalent to 126 effective acres. That is, the nearest area had 70 visits, the next most distant one had 44 visits from the same residential area; 44 divided by 70 equals a coefficient of .63 which, applied to a gross area of 200 acres, equals the 126 effective acres. On the same basis, the third reservoir has 80 effective acres (28 divided by 70, multiplied by 200); the fourth has 46 effective acres; the fifth, 20 effective acres; and the sixth and more distant reservoirs (if any), an effective acreage of zero. The total effective acreage for this string of reservoirs thus is 472 acres (200 + 126 + 80 + 46 + 20), while the gross acreage is at least 1,000 (it might he much more if there are still more distant reservoirs).
Like the demand analysis for one area visited by people from different locations, this analysis of the effective acreage of a chain of essentially similar reservoirs is easier to state, under many simplifying assumptions, than it is to apply in particular real life situations. A chain of areas is unlikely to be so neatly located at regular distances from the user, the recreation areas probably would differ in various ways, and hence in attractiveness, and one can imagine many other complicating situations. Nevertheless, just as the distance-travel analysis of the demand for the whole recreation experience has proved basic to all the recreation demand studies of the past two decades, so can the Effective Acreage Equivalent analysis be basic to all attempts to convert different outdoor recreation areas to a common denominator.
How might this basic concept be applied to some major types of outdoor recreation situations? We provide below a simplistic application to some of the recreation areas of the United States.
Applying Effective Acreage Equivalents
The simplest situation in which the concept might be applied is a real life more or less corresponding to the hypothetical one outlined above—residents of one city and its suburbs traveling to recreation areas of closely similar characteristics and attractiveness at different distances from the city. These areas are primarily suitable for single-day use—too far away for after-work visits and not attractive enough for vacations. This sort of satiation might arise if the city or the county proposed to acquire one or more day-use areas and was trying to decide which area offered the best bargain—the most recreation opportunity for the money. Close-in areas are more useful, but also are usually more costly. Is a close-in area at a high cost a better or a poorer bargain than a more distant area at a lower price? Since the various sites probably would differ, at least somewhat, in innate attractiveness, research in generally similar areas around this or other cities might establish, perhaps by correlations among variables or by a Delphic process involving some of the community's leading citizens, the importance of various factors in addition to or including distance. Thus, necessary coefficients for converting surface acres Effective Acreage Equivalents could be calculated or estimated. By this process, the various possible alternative tracts could be reduced to an acreage equivalency. But while this might greatly assist the decision process, it clearly would not solve all the problems: difficult and essentially political choices would remain.
Something of the same problem, but more difficult, would arise if the decision-making body were a state agency that planned to establish the new day-use parks. The problem in this situation would be complicated by the existence of many towns, cities, and suburbs, which would form an intricate and irregular network of demand from which users would travel varying distances to a network of parks, perhaps equally irregularly scattered over the state. The computational problems in coping with this situation would be greater—perhaps very much so—but the same general principles would apply. That is, state parks closer to large numbers of city residents would be more valuable than parks farther away. Differences in innate attractiveness probably would be a more serious problem here, but not an insurmountable one. Again, many difficult decisions of an essentially political nature would need to be made, but if the state agency, the governor, or the legislature wanted an objective and quantitative measure of the relative adequacy of parks in different parts of the state, then the Effective Acreage Equivalent would be the best measure. For this problem, as for the immediately foregoing one, coefficients per unit of surface area would have to be estimated by some means. It seems probable, if the other aspects of this definition are as we have defined them, that the same coefficients can be used for each problem and for the state as a whole.
A generally similar but still more complex situation would arise in an attempt to estimate an Effective Acreage Equivalent for all states and regions, but still confined to intermediate type day-use areas. This was one of the concerns of the original Outdoor Recreation Resources Review Commission—how to compare park adequacy in different parts of the country. The problem is complicated not only by the extraordinarily complex pattern of city, town, and suburban locations and by the existing pattern of day-use areas, but also by the fact that different climates permit different use patterns of essentially similar areas, that people living in different parts of the country have different average incomes and different tastes for outdoor recreation, and by other factors. Still, if the Land and Water Conservation Fund or any other source of federal funds attempted to distribute funds on some measure of need, then a reliable Effective Acreage Equivalent would be extremely useful. Even if no such provision were written into law, it may well be assumed that members of the Congress from different parts of the country would use the concept to assert their greater need and stronger claim to more federal funds.
The problem of estimating Effective Acreage Equivalents for all parts of the country—even for just the day-use areas—while difficult, is not as formidable as estimating them for different kinds of areas. The methodology of the latter, discussed in the next few paragraphs, is equally applicable to national areas of a similar kind.
Comparing apples and oranges
By far the most difficult estimation problem arises when many kinds of areas differ not only physically and in attractiveness, but also in use patterns, from those close enough to users to permit visits after work and after school, to intermediate areas primarily for day use, to distant areas used mostly for vacations. All the enormous physical and cultural variability and richness of the United States compound this problem. Clearly, no measure can capture all the variations and subtleties, but a reliable general measure would have much value.
Solving this complex problem will require several steps. First, reasonably reliable demand curves for each kind of area in each major location or region of the country are necessary, either by field work and statistical analysis or by the Delphic approach suggested earlier. From these could be calculated coefficients for converting surface acres into Effective Acreage Equivalents for each major kind of area in each region. The bigger problem arises in comparing one kind of area with an-other. But, if demand curves existed for each kind of area, conversion factors from one coefficient to another could be calculated. One might compare the surface area—recreation use ratio on the various demand curves at any one and preferably all three of the following points:
- At the median relation between maximum and zero use for each, if the demand curves measured such points
- At the maximum use rates where rent was zero, or where no further use occurred because costs of getting to the area and using it fully consumed all the values of the experience, leaving nothing for rent of the site
- At some slightly higher point on the demand curve, where rent or the surplus of value above zero was at, say, 10 percent of the maximum—this latter to avoid undue reliance on the extreme end of the frequency distribution, which is always less accurately measured than is one defined position within the frequency.
Table 2. Attendance, Surface Acres, and Effective Acreage Equivalent for State Parks The National Park System, National Forests, and County and Municipal Parks, Circa 1980
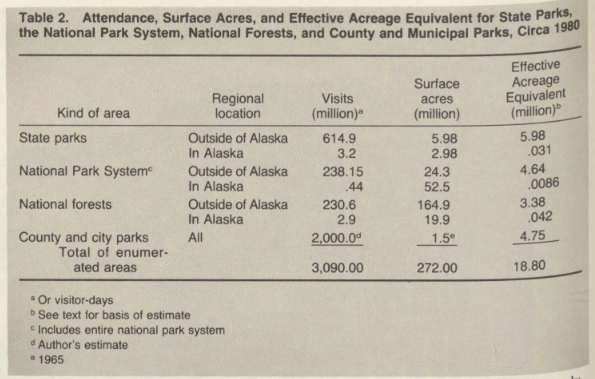
The rationale for this process is as follows. Every person visits each kind of site until the site rent for him or her is zero. This obviously depends in large part on the interests, the income, and the location of each potential user. Costs are incurred for the whole recreation experience, and in some cases this may include modest charges for use of the area—as admission charges and user fees for parking, boat launching, camping, and the like. But for most publicly provided outdoor recreation areas the charges are zero or relatively low. The costs for the whole experience may be high for the user—perhaps significantly so in time and energy—but the rent for the marginal visit will be zero or the small amount actually charged for use of the area. It is reasonable to conclude that the rate of visitation for each area will increase until the rent for the site is zero (or the amount actually charged for its use), regardless of the costs of the whole recreation experience.
The ratio of visits to areas at the zero-rent margin provides one basis for the conversion of surface areas to Effective Acreage Equivalents for areas of different kinds.
Approximating equivalents for the United States
Applying this method to the whole United States on a fully quantified and empirically sound basis would be an immensely challenging process, requiring a large amount of data, some of which is not readily available, and also conversion coefficients, none of which have yet been estimated with detail and accuracy. But very rough approximations can be calculated for some major kinds of outdoor recreation areas that will at least illustrate how this method of analysis would work (table 2).
The point of departure is the average acre of state parks outside of Alaska; this is the effective acre standard to which other areas will be compared. In the period around 1980, this average state park acre had 103 visits. Using this as the zero-rent margin of use, the more than 3 million acres of state parks in Alaska shrink by a factor of nearly 100. The average acre of the National Park System outside of Alaska a had nearly 10 visits per acre; adjusting its surface acres to an effective acreage basis in comparison with the zero-rent state park acre, but allowing for the fact that the average visit to a national park might have averaged twice as long as did the average visit to the state park system, results in an Effective Acreage Equivalent for the National Park System outside of Alaska of 4.64 million acres—somewhat less than for the state parks. By a similar process of adjustment, the effective acreage of the National Park System in Alaska shrinks greatly, to fewer than 10,000 acres. By similar calculations, the National Forests outside of Alaska have about three-fourths as many effective acres as does the National Park System outside of Alaska and somewhat more than half the effective, acreage of the state parks outside of Alaska.
In contrast, the city and municipal parks—about which our information is seriously lacking and for which a reasonable estimate of use may be in large error—have more than three times as many effective acres as they have surface acres. This is despite the fact that visits to such areas are estimated to be only a fourth as long on the average, as are the visits to the state parks.
In spite of the lack of detailed analysis, both geographically and by kinds of areas, and in spite of the necessarily rather arbitrary assumptions on which the calculations thus had to rest, the results both illustrate the method and provide some estimates that intuitively seem reasonable. The vast acreages in Alaska are shrunk by a factor of 100, more or less; the rest of the National Park System is shrunk by a factor of about 5; the national forests outside of Alaska are shrunk by a factor of about 50; but the city and county parks are increased by a factor of about 3.
In a 1958 publication, reissued this year along with current data on many of the same topics, I wrote that "the difficulties of summarizing statistics on recreation in different areas are apparent for land—the one factor, one might think, for which a common denominator could most easily be obtained." It took more than a quarter century and there are many reasons for the public to hold land, including wilderness, watershed, timber production, and wildlife habitat, but for outdoor recreation purposes the concept of Effective Acreage Equivalents at last offers hope of carving some order out of confusion.

Author Marion Clawson is senior fellow emeritus in RFF's Renewable Resources division.


